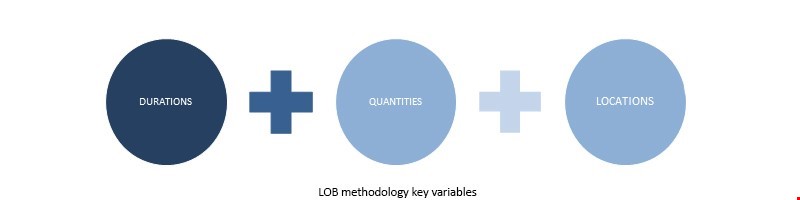
Throughout the construction industry evolution, both owners and builders looked for an ideal planning methodology that allows them to effectively control the entire development of their projects and therefore lead them to success. This article does not present that ideal solution, however it indicates a more efficient alternative, to the means normally used, while adding a new variable – the project locations.
Line of Balance
The use of a BIM Methodology in Construction Planning
General
Throughout the construction industry evolution, both owners and builders looked for an ideal planning methodology that allows them to effectively control the entire development of their projects and therefore lead them to success. This article does not present that ideal solution, however it indicates a more efficient alternative, to the means normally used, while adding a new variable – the project locations.
“It is one thing to know about the location-based theory and its associated methods, it is another to know how to use that knowledge to build effective schedules for a project and to both plan for production efficiency and provide confidence” (Kenley e Seppänen)
As Kenley and Seppänen defend, there is a difference between knowing the methods of location-based planning and knowing how to use them in order to achieve the perfect Schedule and still control the production of the entire project. Most companies in this industry continue to rely on CPM methods, generally based on Gantt diagrams, despite its several and well-known limitations.
The renowned Gantt diagrams have been developed solely for planning the workload, deadlines and responsibilities in a generalized way, being perfectly suited for these functions. The problem lies in the fact that these diagrams describe the process in only one location. . In other words, this method was not designed to plan and monitor multiple teams in different workplaces, even though it is mostly used for this purpose. Thus, the Line of Balance (LOB) presents itself as a solution to the main limitations of the traditional method, enabling new features: multiple locations, task continuity representation, dependency visualization, resources flows and team planning, as well as the inherent productivities.
Concept
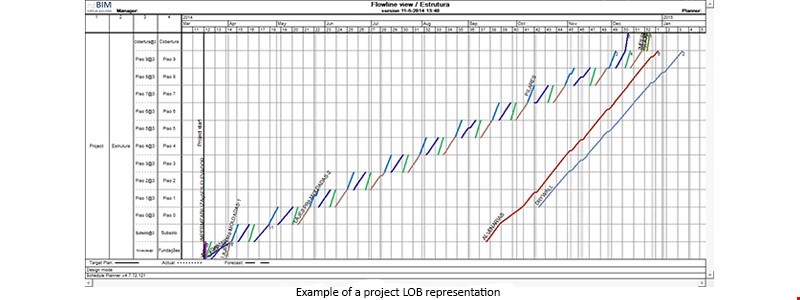
Generally, the Line of Balance can be defined as a graphical planning methodology, which represents, in a single view, all the various locations and tasks of a project. An illustrative figure of this concept is presented below. On the vertical axis locations are presented, time on the horizontal axis and the lines represent the activities. The slope of the lines represent the activities productivity, and the higher the slope, the bigger the task production rate.
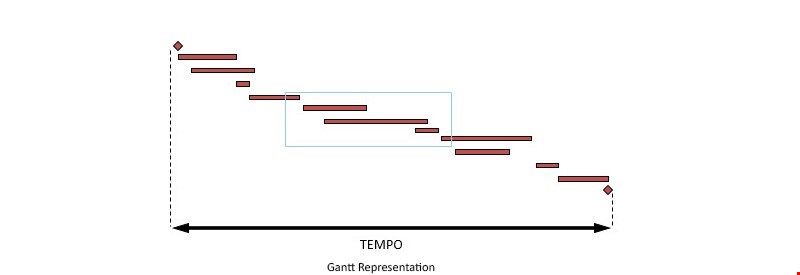
By way of example, consider the three tasks shown above on a typical Gantt chart, referring to a general project.
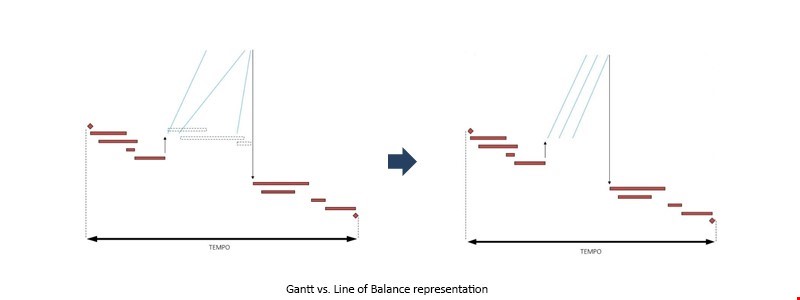
This scheduling methodology, due to its ease of visualization and analysis of work, allows for an optimization of the project management through the alteration of the production rate, use of continuous work and better use of site locations throughout construction time.
These variations may imply changes in the team(s) productivity and/or a change in the composition and/or number of gangs. Looking at the image below, where the tasks were converted to the LOB representation and optimized, it is possible to verify the result of applying this method assumptions, i.e., a reduction in the project total duration without increasing its risk.
As can be understood, these changes imply costs variation due to the resources variations and their temporal allocation modifications. Furthermore, it is worth highlighting the fact that the existing platforms supporting line of balance enable the user to easy handle and manage the resources.
In short, the Line of Balance allows you to compress the schedule duration, analyzing, on a unique view, all the activities and their dependencies, lags and buffers.
Software
Nowadays, this methodology is already included in some BIM software that considers both the quantities and costs, linked to the locations in which the elements of the model are located.
This article will focus on the software capabilities that, from ndBIM’s point of view, is the most complete and still user friendly: Schedule Planner, developed by Vico Software. Since this is one of the Vico Office’s modules, this application allows users to integrate quantities extracted from the BIM model, with the associated resources and locations, allowing the elaboration of a highly detailed and optimized schedule.
The 4D Planning results from the symbiosis between the 3D BIM Model and the associated resources optimization. Thus, all the quantities are extracted from this geometry and allocated in different areas of the project. At this point and using the LOB view – Vico Flowline View –, it becomes feasible to change the sequence of tasks and locations as well as the composition and size of teams, their productivities and costs, splitting tasks and the introduction of gaps (Buffers). By creating this optimized schedule you can minimize – or even eliminate – the start and stops, reducing the inherent risk and still preserve the continuity of the work.
The integration of the model, the quantities, the locations and cost plan is essential if we take into account the increasing demand from the owners concerning planning techniques that consider both costs and resources variations throughout the different phases of a project. Therefore, this methodology allows teams to plan the project cost at a given point and to compare it with the actual cost of the finished work.
In order to achieve true 4D BIM, Schedule Planner allows you to set up the initial project planning in an effective way and also offers excellent production control tools. In Vico Flowline View, you can switch to control mode and, through the Schedule Task Control Chart, enter the actual values/quantities and dates of each task location work performed.
This data is shown at a control matrix where it’s possible to visualize tasks horizontally, locations vertically and each cell has the following: target start and end date, actual start and end date or percentage concluded. This information appears as a color code for a simpler analysis (explanation at image legend).
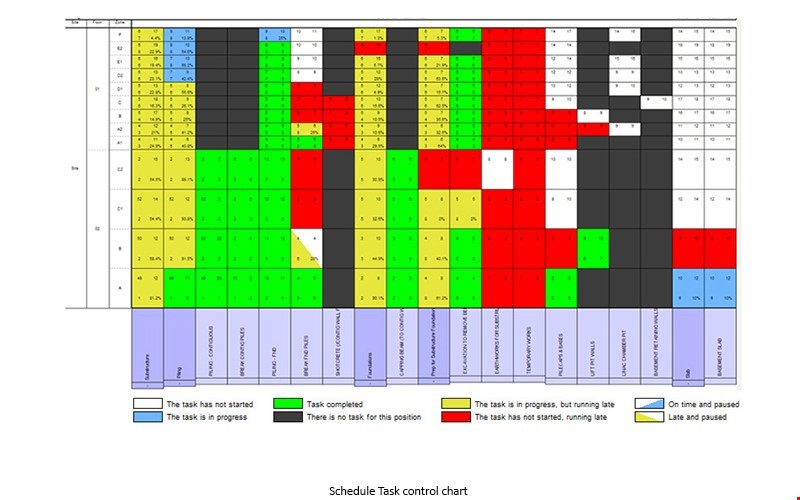
Thus, one obtains a representation of three scenarios: target, real, and forecast. Forecast is achieved based on the information inserted of work performed (quantities and dates), calculating actual productivity per task that is applied to the remaining work, besides always taking into consideration the dependencies. The software also generates alarms and warnings referring to the project critical areas.
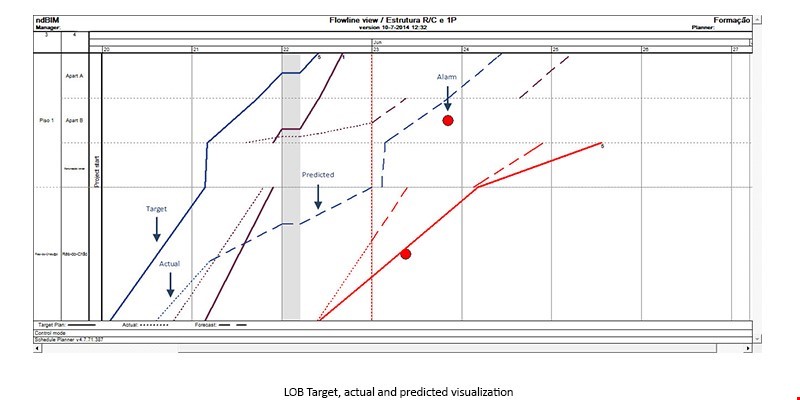
The use of real productivities for predicted dates throughout the project is a major difference from Gantt tools, as it is MS Project, which does not considers this values. Thus, the Line of Balance allows a superior forecast of the end date of the project, as well as the production through time of the quantities of every task.
Additionally, Vico Office has a feature capable of creating a 4D project simulation, where you can visualize a 3D animation with the construction process through time due to the full integration of the model with the schedule.
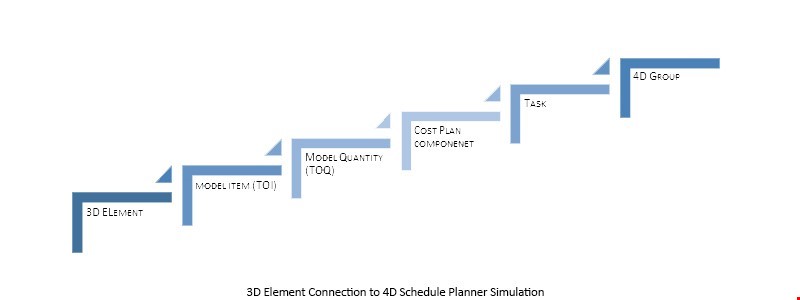
The 4D Simulation is one of the automatic deliverables of the Vico Office planned projects. The 3D model components are directly related to the budget, which relates to tasks with location information that are edited on the schedule tool. The different tasks are assembled into 4D Groups that allow the user to edit the behavior elements will appear on the 4D simulation. This structure is represented below:
The video follows the model geometry, as well as the quantities by location and the teams’ productivities that were placed in Schedule Planner – being the video speed set by the user. This tool is extremely useful because it acts as a facilitator and communication instrument with the owner, subcontractor and other site actors, allowing a superior perception of the work schedule. Furthermore it’s an important quality assurance tool related to the line of balance schedule elaborated because allows for the user to verify, in 3D, if the execution order of work per location is feasible.
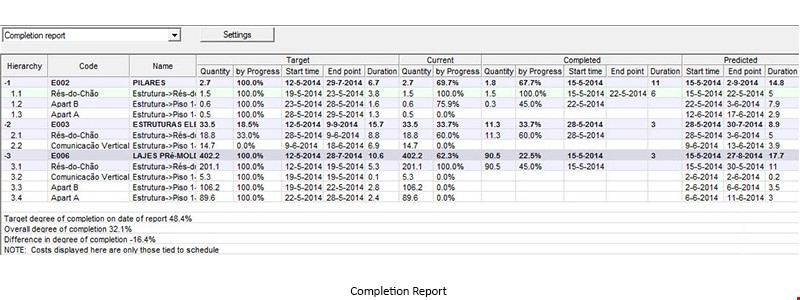
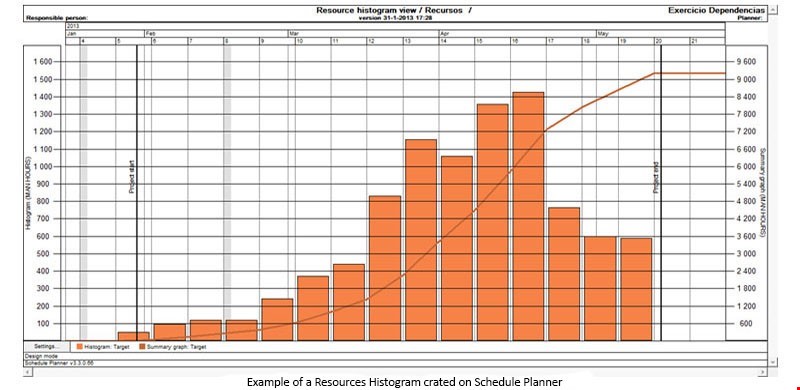
Last but not least, the Schedule Planner generates numerous charts and reports, with all the information related to target, actual and forecast of dates, productivities and resources that can be easily interpreted by all the project stakeholders and exported to Excel for editing when needed. It is possible to visualize an example in the image below.
Meanwhile, we can also create resource histograms (as shown in the following figure) by task or resource, cash-flow graphs of the work, reports of existing floats, quantities by location, production status, tasks, and so on.
Advantages
By implementing a management system based on the LOB theory, you can achieve a number of significant advantages, as noted below:
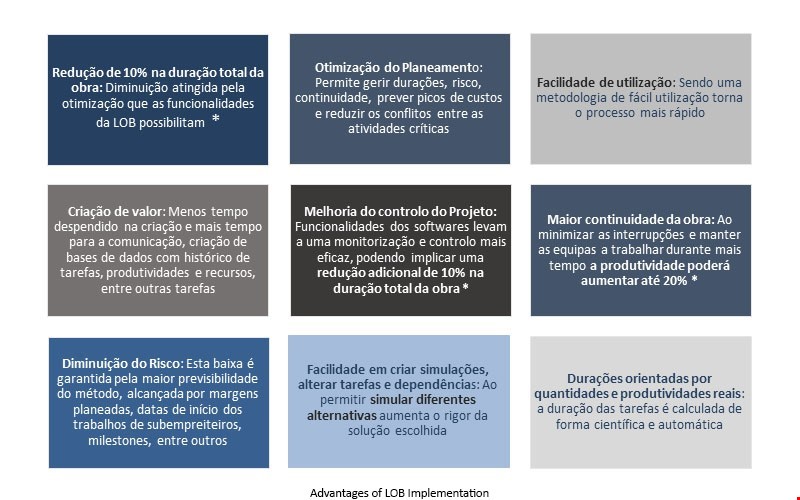
* Percentage values withdrawn from the book “Location-Based Management for Construction” (Kenley, R.: Seppännen, O., 2010)
Process
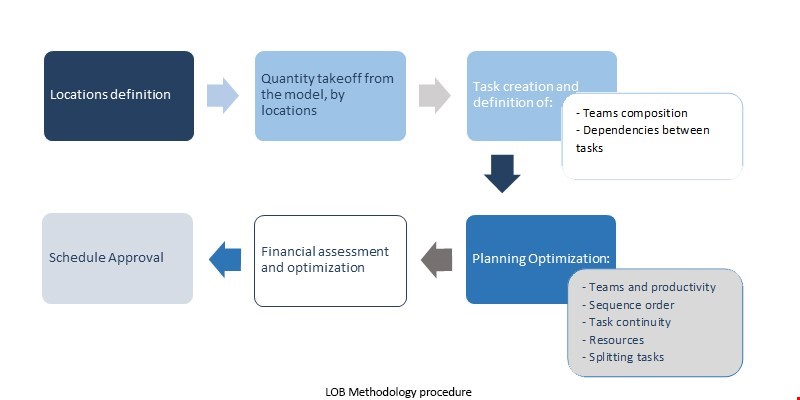
The LOB methodology, integrated in a BIM process, contrarily of what the professionals of the construction industry may think is, after a first contact, simple to understand and analysis, resulting a logical development, tracking the natural course of the work preparation.
The procedure begins, generally, at the BIM model elaboration, so quantities by location can be obtained automatically for Schedule Planner. After having a model, the procedures sequence for creating a schedule should follow, in general, the structure presented next:
Implementation
The implementation of a new methodology always faces some obstacles, particularly the natural reluctance of people to change and the lack of familiarity to the new process and software. The Line of Balance adoption implies a paradigm shift. The methods followed religiously for generations stand as outdated and, in the opinion of ndBIM, should be enhanced by a new method and, consequently, a new technology.

A construction project involves multiple stakeholders in diverse phases that must work with each other in a team in order to lead a project to success. The methodologies and tools present at a company must be understood and accepted by all, otherwise inefficiency and information lost will occur, they shouldn’t be imposed to all like buying a software package. The strategy must be to first diagnosis the company, knowing the teams, their skills, experience and profile, as well as the current process in use. With this data it’s possible to implement the new scheduling methodology and tool, alongside with eventual upstream processes needed to an effective use.
There isn’t a generic implementation solution that applies to any case. The processes and technology can be bought or developed. However, without proper motivation and understanding from People the success will be much harder to achieve.
Conclusion
Although there is still an prevailing use of CPM diagrams associated with the construction planning, already exists some awareness about the intrinsic potential of the methodology presented in this article and, therefore, its acceptance by enterprises should be increased, because of the success that some stakeholders have already acknowledged.
The use of Line of Balance enables to elaborate a schedule and perform its optimization, without any increment of the related risk, through the incorporation of locations, quantities, costs and productivities. The control tools present in the software allows for a superior forecast of tasks, taking in consideration real productivities which, combined with unit cost values permits an excellent update of the financial schedule until the end of works, in a simple and automatic way.
Line of Balance is a solution for those who intend a simple and fast schedule tool, yet powerful, that allows for a real optimization process and that actually supplies the site management team useful data for decision making. Allows a clear identification of both conflicts and critical areas of the schedule, as well as gap management between tasks. Presents all information in a single compact view, contrary to the current industry standard use of Gantt charts, causing the work schedule to be presented in a useful way to all actors without effort.
ndBIM can help you implement this methodology in your company by offering an empowerment program in the methodology and technology, as well as provides the appropriate monitoring support. Reach the best implementation advice, due to the large number of 4D implementation cases! If you do not want to incorporate these skills, check our website and see our 4D back office services!
It is complex to achieve an efficient project management in construction, due to the amount of information that is associated to the process. If the construction companies have that awareness, why do they not evolve the method?